
Week 6: Batch or Flow Lover?
- Group 4
- May 15, 2020
- 3 min read

Lecture
In this week’s lecture, we had our midterm presentation, and if you would like to watch it, here is the link to the video: https://www.youtube.com/watch?v=r0MEu--6MLQ. In the lecture we discussed how we could experiment with the extraction process and compare the two processes: batch and flow. For this week’s experiment, we will be comparing the coffee concentrations from the bath and flow process. By doing so, we can determine which extraction process yields more coffee concentration and find the optimal extraction process.
Planning
To compare the two different extraction processes, we decided to conduct two experiments in total. Experiment #1 was testing the coffee concentration at different temperatures (23 °C, 68 °C, and 93°C) using the flow method, which has the same steps as week 3 procedures. After conducting experiment #1, we will conduct experiment #2 which will be conducted using the batch extraction process. We used 40 grams of fine ground coffee and 2 cups of water. We then added the 40 grams of coffee into two cups of 23°C of water and started the timer. Every 2 minutes, we collected a sample by filtering enough of the extract that will produce an accurate conductivity reading, we did this for 16 minutes. We measured the conductivity of each cup three times and recorded it. We repeated experiment #2 but using different temperatures: 23 °C and 93 °C. We expect that the batch extraction process will yield a higher coffee concentration, and the higher the water temperature, the higher the amount of coffee extracted.
Laboratory
The experiment was conducted successfully, and the steps ran smoothly. Since our group wanted to make sure that we would collect enough samples of the coffee to measure conductivity, we still kept a 1:1 ratio of water to coffee grounds, but we increased both of the factors by two so the solid-liquid ratio would stay constant.

Figure 1: Two cups of water will be placed in a large container. Then the 40 grams of coffee grounds will be added and every 2 minutes a sample will be collected filtered.
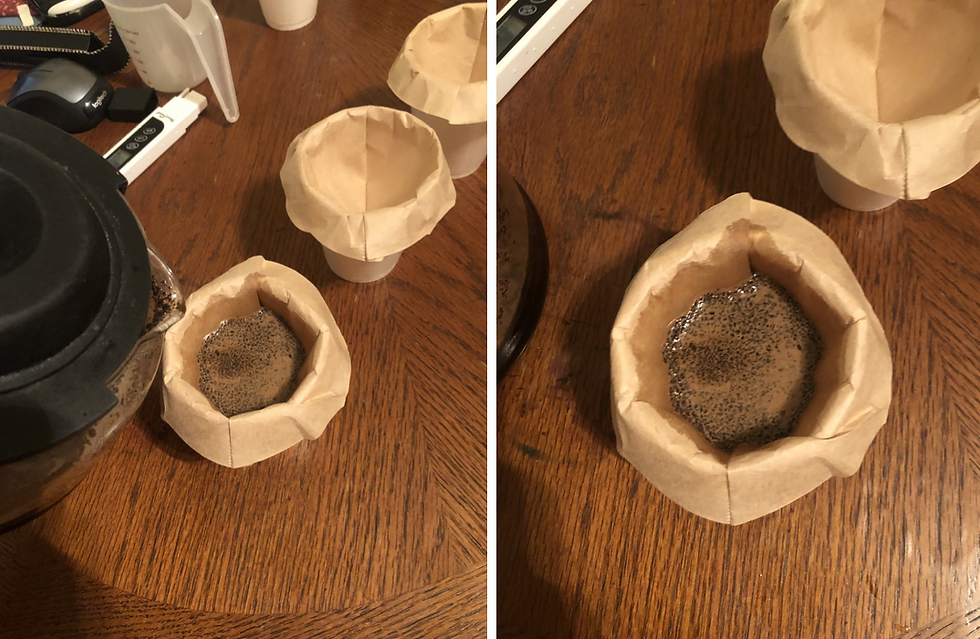
Figure 2: After 2 minutes, the sample of coffee was filtered into cup #1
The steps will be repeated for every 2 minutes, a sample of coffee will be filtered to cup #2, and so forth, shown in Figure 2.
After 16 minutes and all the samples have been collected, we waited for all of the samples to become room temperature since we know that conductivity is dependent on temperature. After all the samples became room temperature, the conductivity was measured and recorded just as shown in Figure 3.

Figure 3: After the samples become room temperature, the conductivity was measured using a conductivity probe.
Results
After obtaining the measurements, we calculated the concentration of each cup by using the slope of the calibration curve made in week 2. We later graphed out Concentration vs. Time for batch and flow at different temperatures. Figure 4 and Figure 5 show the data we obtained and summarized.
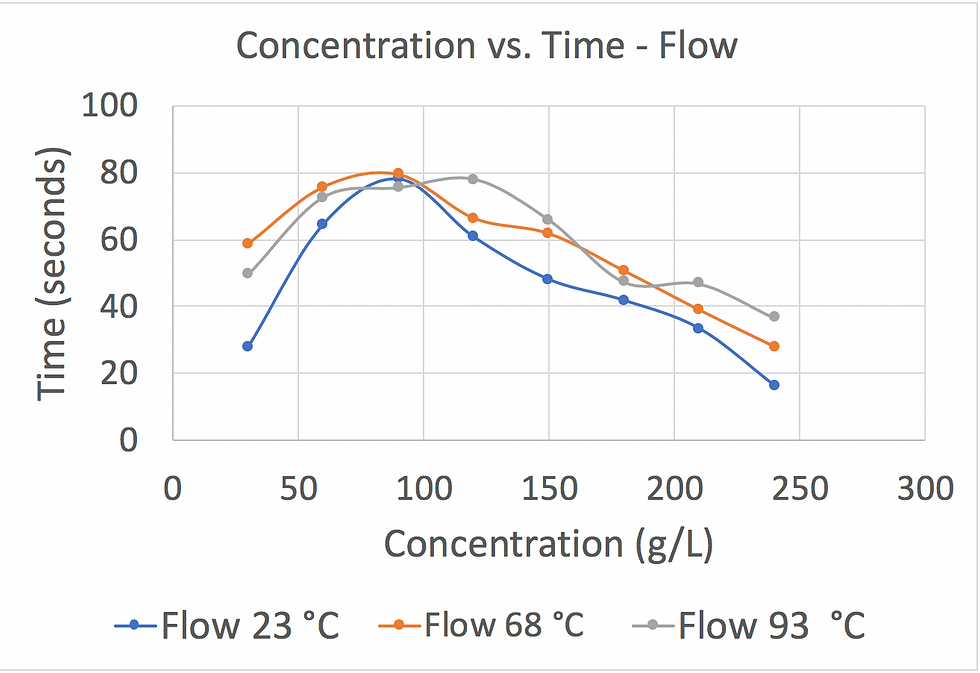
Figure 4: This graph shows that the higher the water temperature, the higher the coffee concentration in a flow extraction. The lowest water temperature yields the lowest coffee concentration in this experiment.
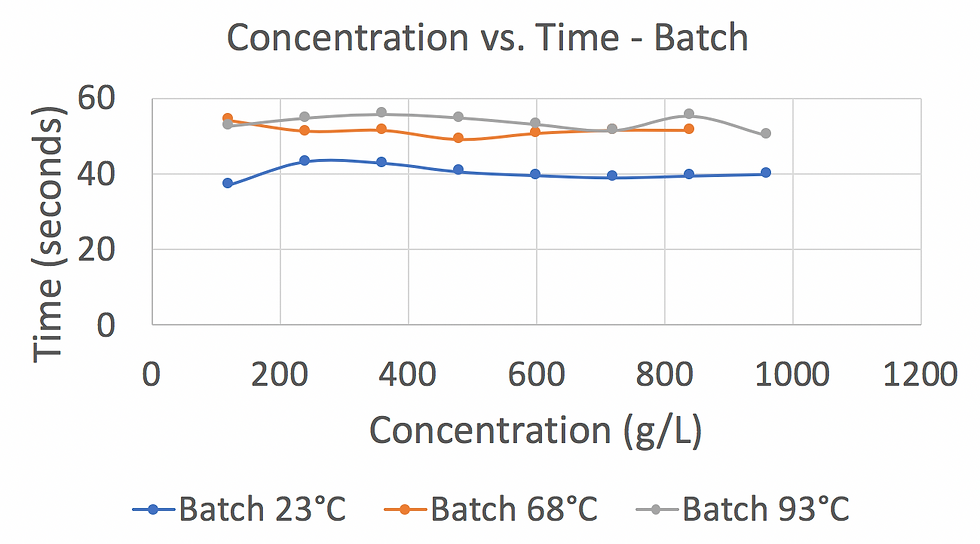
Figure 5: This graph shows that the higher the water temperature used for the bath extraction, the higher the coffee concentration.
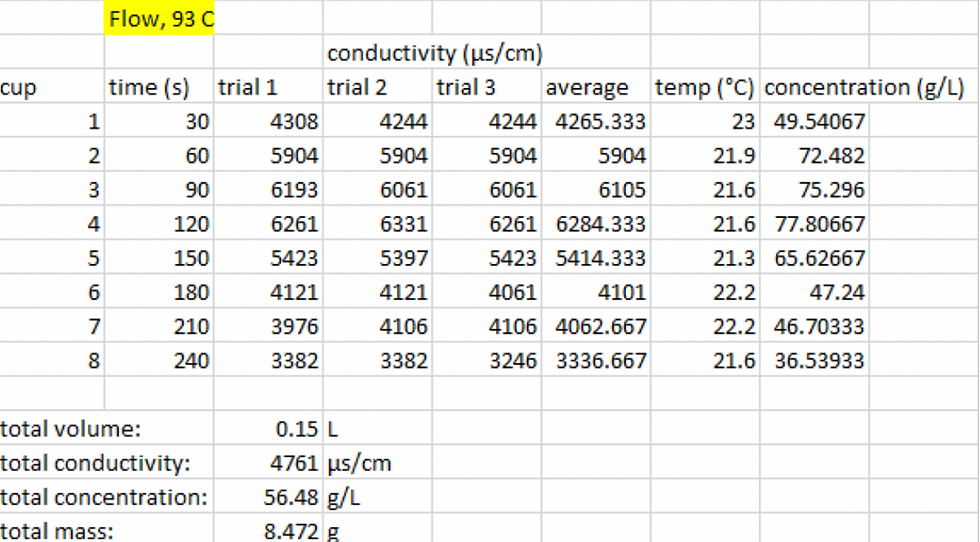
Figure 6: The data that was collected during the experiment for flow extraction process
at 93 °C.
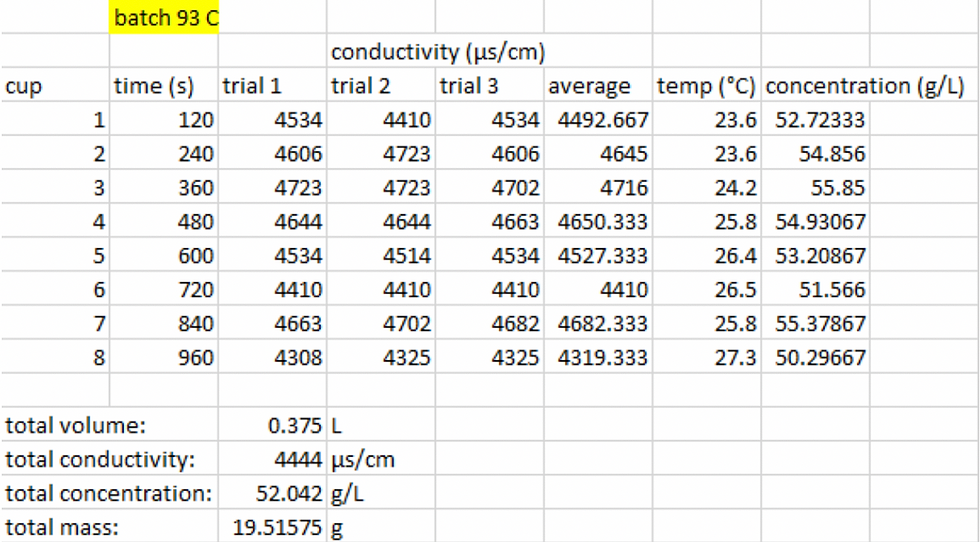
Figure 7: The data that was collected during the experiment for the batch extraction process at 93 °C.
Comparing the flow and the batch coffee concentrations at the same water temperature, we can determine which extraction process is more optimal. Looking at Figure 6 and Figure 7, we can see that the coffee concentrations of a batch significantly higher than the concentration of flow. From the data, we can also conclude that the total mass of extracted coffee from batch (19.51 grams) is significantly higher than the flow (8.47 grams). This concludes and supports our hypothesis that the batch extraction yields a higher coffee concentration than the flow process.


Comments